SmartView tracker is an excellent tool. Checkpoint implements not just brilliant logging but also tools via which you can dig into the log files and file the logs you really need. With SmarView Tracker you can query the data and find what you need.
SmartView Tracker has 3 main categories or modes:
- Log – you can check the log file
- Active – you can check the realtime logs
- Audit – who did what and when
You will see that SmartView Tracker has a predefined queries however you can easily create also your own queries and store them for future usage. By default all the logs are sent from FW to the Manager server. We can store it in the FW but thats not the default behavior. We can also set the Manager server to sent the logs to different log destination, if we have some central logging server solution.
There is also something called Manual Block. And you would not expect this functionality in SmartView Tracker. In the Active mode you see the actual firewall connections. And what if you see some intruder or suspicious traffic. How do you stop that traffic? You can do it inside SmartView Tracker via this Manual Block functionality. I think they implemented it here because it would take too much time to login to smart dashboard and block it from there. But there is caveat for this block feature. It is recommended to be used in SmartView Monitor not in SmartView Tracker as here you have to use the active mode and that can hang the CPU of mgmt server.
In the picture below you can see the SmartView Tracker. In top menu there is Network & Endpoint section, Active section and Management section. These are the 3 main modes I described early. On the left side we can see the predefined queries for SmartView Tracker.
![]()
Filtering the logs is very easy. You just need to right click on column you want to filter and edit the filter. Check the screen below where we are editing the Service column.

You can also right click on the log record and choose follow source/destination. So you can see all the log records for specified follows. Advantage of follow is that you can set up for automatically update just for this specific record so you are not overhelmed with all the active sessions.
In SW Tracker you can also switch the log file and make new one the active one and this one is now rotated. Check the screen.

This also means that we dont have just one log file but log files are rotated regularly based on our settings. So to search on old log files you would have to go and open the right log files. And that could be a challenge to go and open the right log file. For that we have another log tool called SmartView Log which search through multiple log files to find what we need. And there is also SmartView Reported which can collect the information through all the log files for us and consolidate it. When you rotate the logs the hit counts for the Access Control Entries disappear. But to see all the hit counts for a specific rule you just right click on rule in dashboard and choose vie rule logs.
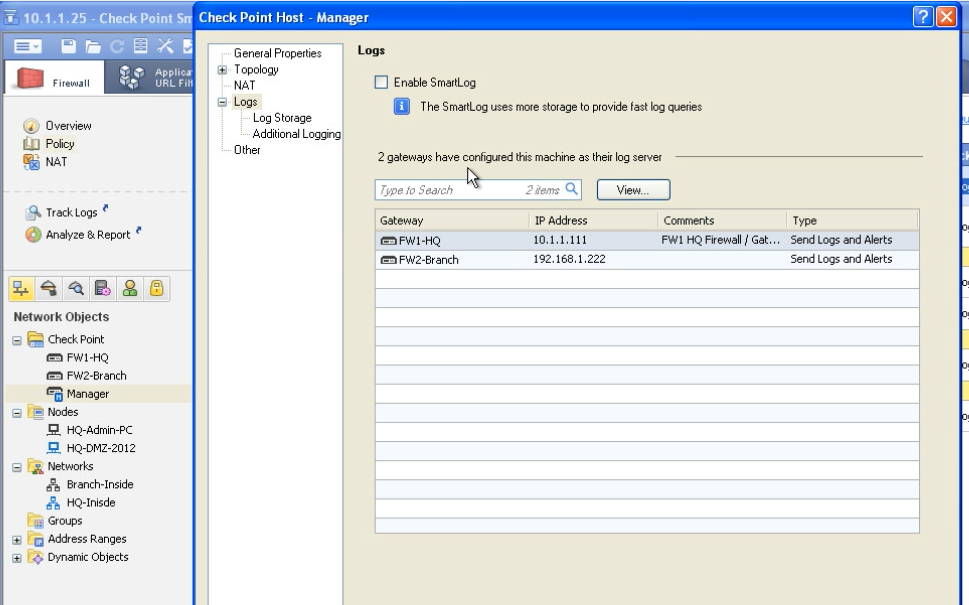
You can configure the logging settings in the checkpoint manager object in dashboard. Just double-click on the object and the menu will pop up. Same settings are available under the firewall object itself, but by default logging is on the manager server not the firewalls itself.