BIG-IP LTM can check status and health of the members and nodes to assure it doesn’t send the client request to non operational server. Monitor is a test BIG-IP performs on a node or member. The monitor can be as simple as ping or more advanced like sending L7 requests with appropriate responses. A monitor generally test a specific node or member for an expected response within a defined time frame.
Monitor types
- Simple monitoring – merely determines whether the status of a node is up or down. Simple monitors do not monitor pool members (and therefore, individual protocols, services, or applications on a node), but only the node itself. The system contains two types of simple monitors, ICMP and TCP_ECHO.
- Active monitoring – checks the status of a pool member or node on an ongoing basis, at a set interval. If a pool member or node being checked does not respond within a specified timeout period, or the status of a node indicates that performance is degraded, Local Traffic Manager can redirect the traffic to another pool member or node. There are many types of active monitors. Each type of active monitor checks the status of a particular protocol, service, or application. For example, one type of monitor is HTTP. An HTTP type of monitor allows you to monitor the availability of the HTTP service on a pool, pool member, or node.
- Passive monitoring – occurs as part of a client request. This kind of monitoring checks the health of a pool member based on a specified number of connection attempts or data request attempts that occur within a specified time period. If, after the specified number of attempts within the defined interval, the system cannot either connect to the server or receive a response, or if the system receives a bad response, the system marks the pool member as down. There is only one type of passive monitor, called an Inband monitor.
Monitor Implementation
You can implement a pre-configured monitor or custom monitor. A pre-configured monitor is an existing monitor that Local Traffic Manager provides for you, with its settings already configured. A custom monitor is a monitor that you create based on one of the allowed monitor types. If you want to implement a pre-configured monitor, you need only associate the monitor with a pool, pool member, or node, and then configure the virtual server to reference the relevant pool. If you want to implement a custom monitor, you must first create the custom monitor. Then you can associate the custom monitor with a pool, pool member, or node, and configure the virtual server to reference the pool.
Pre-configured monitors
You cannot modify pre-configured monitor settings, as they are intended to be used as is. The purpose of a pre-configured monitor is to eliminate the need for you to explicitly create a monitor. You use a pre-configured monitor when the values of the settings meet your needs as is.
Custom monitors
You create a custom monitor when the values defined in a pre-configured monitor do not meet your needs, or no pre-configured monitor exists for the type of monitor you are creating.
If a pre-configured monitor exists that corresponds to the type of custom monitor you are creating, you can import the settings and values of that pre-configured monitor into the custom monitor. You are then free to change those setting values to suit your needs. For example, if you create a custom monitor called my_icmp, the monitor can inherit the settings and values of the pre-configured monitor icmp. This ability to import existing setting values is useful when you want to retain some setting values for your new monitor but modify others.
You can also import settings from another custom monitor instead just from pre-configured monitor. This is useful when you would rather use the setting values defined in another custom monitor, or when no pre-configured monitor exists for the type of monitor you are creating.
- When you create a custom monitor, you use the Configuration utility or a command line utility to: give the monitor a unique name, specify a monitor type, and, if a monitor of that type already exists, import settings and their values from the existing monitor. You can then change the values of any imported settings.
- You must base each custom monitor on a monitor type. When you create a monitor, the Configuration utility displays a list of monitor types. To specify a monitor type, simply choose the one that corresponds to the service you want to check. For example, if you want to want to create a monitor that checks the health of the HTTP service on a pool, you choose HTTP as the monitor type.
- If you want to check more than one service on a pool or pool member (for example HTTP and HTTPS), you can associate more than one monitor on that pool or pool member.
- Checking services is not the only reason for implementing a monitor. If you want to verify only that the destination IP address is alive, or that the path to it through a transparent node is alive, use one of the simple monitors, icmp or tcp_echo. Or, if you want to verify TCP only, use the monitor tcp.
Special Monitor configuration consideration
Every pre-configured or custom monitor has settings with some default values assigned. You will find certain topics useful when changing these default values:
- Destination addresses
- Transparent and reverse modes
- The Manual Resume feature
- The Time Until Up feature
- Dynamic ratio load balancing
Destination addresses
By default, the value for the Alias Address setting in the monitors is set to the wildcard * Addresses, and the Alias Service Port setting is set to the wildcard * Ports. This value causes the monitor instance created for a pool, pool member, or node to take that nodes address or address and port as its destination. You can, however, replace either or both wildcard symbols with an explicit destination value, by creating a custom monitor. An explicit value for the Alias Address and/or Alias Service Port setting is used to force the instance destination to a specific address and/or port which may not be that of the pool, pool member, or node.
Transparent mode
Sometimes it is necessary to ping the aliased destination through a transparent pool, pool member, or node. When you create a custom monitor and set the Transparent setting to Yes, Local Traffic Manager forces the monitor to ping through the pool, pool member, or node with which it is associated (usually a firewall) to the pool, pool member, or node. (That is, if there are two firewalls in a load balancing pool, the destination pool, pool member, or node is always pinged through the pool, pool member, or node specified; not through the pool, pool member, or node selected by the load balancing method.) In this way, the transparent pool, pool member, or node is tested: if there is no response, the transparent pool, pool member, or node is marked as down.
Reverse setting
With the Reverse setting set to Yes, the monitor marks the pool, pool member, or node down when the test is successful. For example, if the content on your web site home page is dynamic and changes frequently, you may want to set up a reverse ECV service check that looks for the string „Error“. A match for this string means that the web server was down.
The Manual Resume feature
The Time Until Up feature
By default, the BIG-IP system marks a pool member or node as up immediately upon receipt of the first correct response to a ping. The Time Until Up feature provides a way to adjust the default behavior. This feature allows the system to delay the marking of a pool member or node as up for some number of seconds after receipt of the first correct response.
The purpose of this feature is to ensure that the monitor marks the pool member or node as up only after the pool member or node has consistently responded correctly to the BIG-IP system during the defined time period. With this feature, you ensure that a pool member or node that is available only momentarily, after sending one correct response, is not marked as up.
A Time Until Up value of 0 causes the default behavior. When the Time Until Up value is a non-0 value, the BIG-IP system marks a pool member or node as up only when all pool member or node responses during the Time Until Up period are correct.
Association types
- Monitor-to-pool association – This type of association associates a monitor with an entire load balancing pool. In this case, the monitor checks all members of the pool. For example, you can create an instance of the monitor http for every member of the pool my_pool, thus ensuring that all members of that pool are checked.
- Monitor-to-pool member association – This type of association associates a monitor with an individual pool member, that is, an IP address and service. In this case, the monitor checks only that pool member and not any other members of the pool. For example, you can create an instance of the monitor http for pool member 10.10.10.10:80 of my_pool.
- Monitor-to-node association – This type of association associates a monitor with a specific node. In this case, the monitor checks only the node itself, and not any services running on that node. For example, you can create an instance of the monitor icmp for node 10.10.10.10. In this case, the monitor checks the specific node only, and not any services running on that node.
You can designate a monitor as the default monitor that you want Local Traffic Manager to associate with one or more nodes. In this case, any node to which you have not specifically assigned a monitor inherits the default monitor.
Monitor statuses
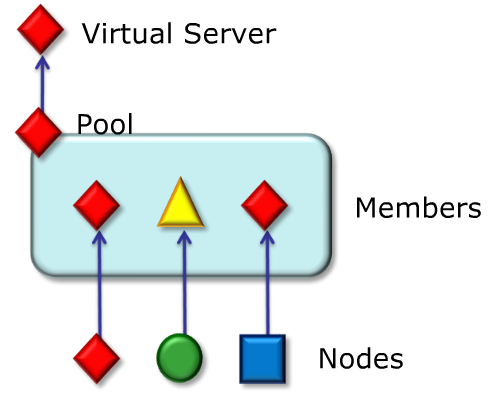
Monitor statuses are very useful for troubleshooting potential issues with servers. You can see if whole node is down or just a member. In picture you can see legend of monitor statuses and logical hierarchy. And by logical hierarchy I mean that status of Virtual server is dependent on status of its pools. Status of Pool is dependent on statuses of its pool member. Status of pool member is more or less dependent on status of node but this is not a rule. For example node can be UP but member is down as service is not running on the node. However when node is down also the member is down.
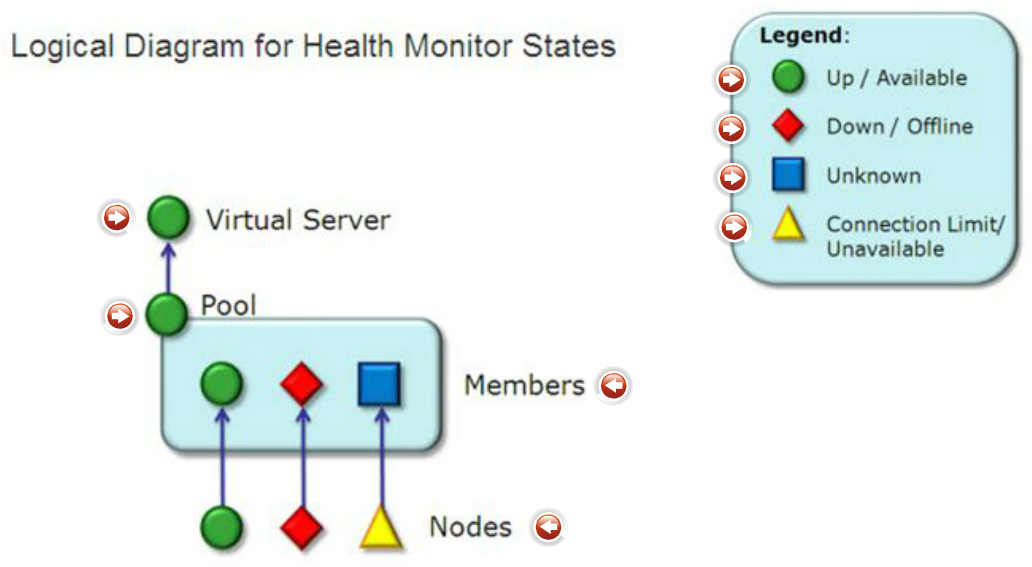
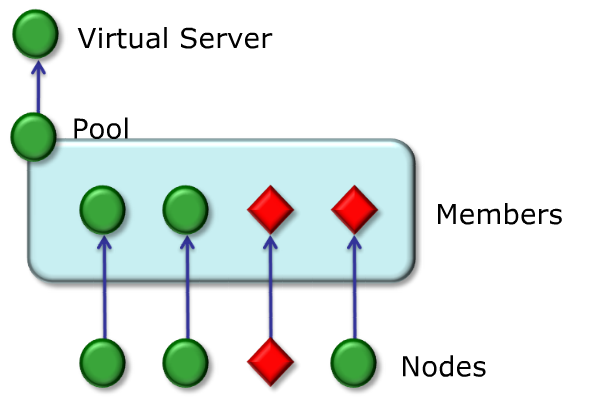
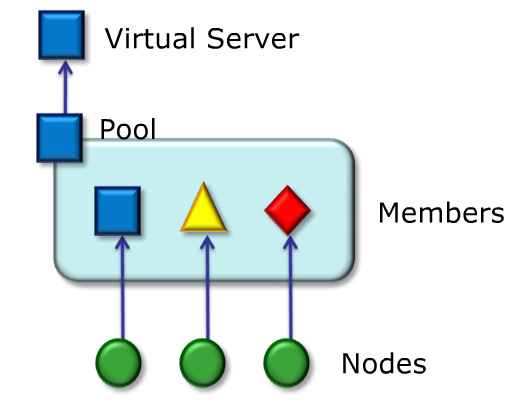
Important to note. When pool is available the VS send traffic to the pool, when pool is unknown the VS sends traffic to the pool. When pool is unavailable or down the VS will NOT sends the traffic to he pool. In other pictures you can see examples of all statuses for virtual server.
- Example of Available/UP Virtual server
- Example of Connection limit/Unavailable Virtual server

- Example of Unknown Virtual server
- Example of Down/Offline Virtual server